Skip to content
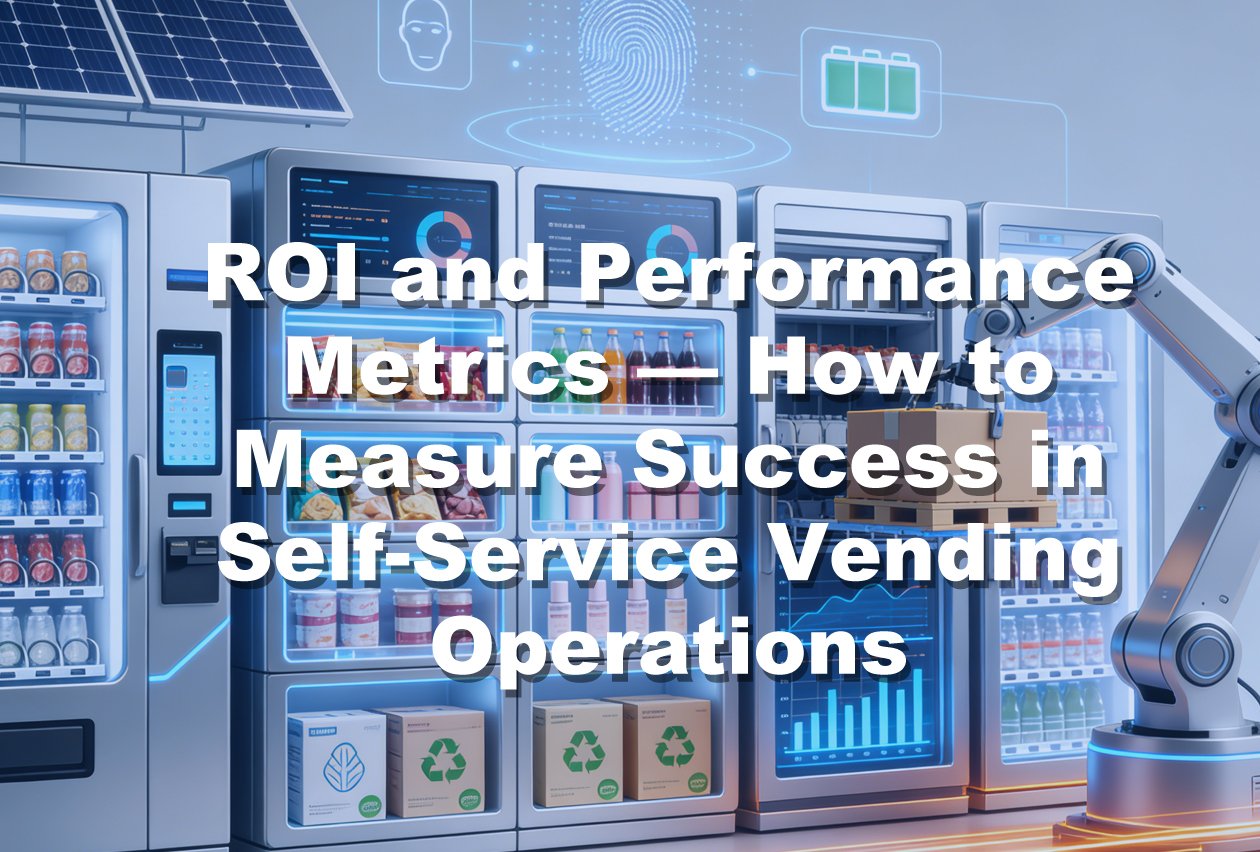
As automated retail becomes more sophisticated, success is no longer defined by how many machines you deploy. In 2026, the most successful operators focus on performance metrics and return on investment (ROI) to guide every decision.
Self-service vending machines are now data-generating assets. Every transaction, every product movement, and every location contributes to measurable performance indicators. Operators who understand and act on these metrics can optimize operations, improve profitability, and scale more effectively.
This article explores the key metrics that define success in automated retail and how to use them to build a stronger vending business.
Why Metrics Matter in Automated Retail
In the past, vending operations were often managed based on intuition and periodic checks.
Today, data allows operators to:
- Measure performance in real time
- Identify problems early
- Optimize operations continuously
- Make informed investment decisions
Without clear metrics, it is difficult to know whether a machine or location is truly profitable.
Understanding ROI in Vending
Return on investment (ROI) is one of the most important indicators for vending operators.
ROI measures how quickly and effectively a machine generates profit relative to its cost.
Basic ROI Factors Include:
- Initial investment (machine, installation, setup)
- Operating costs (inventory, maintenance, commissions)
- Revenue generated over time
A strong ROI indicates that the machine is performing well and contributing to business growth.
Key Performance Metrics Every Operator Should Track
1. Sales Volume
Sales volume measures total revenue generated by a machine over a specific period.
It provides a clear picture of overall performance and helps identify high-performing locations.
2. Average Transaction Value
This metric shows how much customers spend per purchase.
Higher transaction values often indicate:
- Effective product selection
- Successful pricing strategies
- Strong customer engagement
3. Inventory Turnover Rate
Inventory turnover measures how quickly products are sold and replaced.
High turnover indicates strong demand and efficient inventory management.
Low turnover may signal:
- Poor product selection
- Overpricing
- Weak location performance
4. Machine Uptime
Uptime refers to how often a machine is fully operational.
Higher uptime means:
- More sales opportunities
- Better customer experience
- Increased reliability
Downtime directly reduces revenue and should be minimized.
5. Restocking Efficiency
This metric evaluates how effectively inventory is managed and replenished.
Efficient restocking reduces:
- Out-of-stock situations
- Unnecessary service visits
- Operational costs
6. Location Performance
Not all locations perform equally.
Operators should compare:
- Revenue by location
- Sales trends
- Customer behavior patterns
This helps identify which locations should be expanded, optimized, or replaced.
7. Profit Margin
Profit margin measures how much profit is generated after expenses.
It is influenced by:
- Product cost
- Pricing strategy
- Operating expenses
Maintaining healthy margins is essential for long-term sustainability.
Using Data to Improve Performance
Collecting data is only the first step. The real value comes from using that data to make improvements.
Operators can:
- Adjust product mix based on sales trends
- Optimize pricing strategies
- Relocate underperforming machines
- Improve maintenance schedules
Continuous optimization leads to better results over time.
Benchmarking and Goal Setting
Successful operators set performance benchmarks.
Examples include:
- Minimum daily revenue targets
- Desired inventory turnover rates
- Acceptable uptime levels
By setting clear goals, operators can measure progress and identify areas for improvement.
Scaling with Performance Insights
Metrics are especially important when scaling operations.
As the number of machines increases, it becomes more difficult to manage performance manually.
Data-driven systems allow operators to:
- Monitor large networks efficiently
- Identify trends across multiple locations
- Standardize best practices
This makes scaling more manageable and less risky.
Common Mistakes in Performance Measurement
Operators should avoid several common mistakes.
Focusing Only on Revenue
High revenue does not always mean high profit. Costs must also be considered.
Ignoring Underperforming Machines
Keeping low-performing machines without adjustment can reduce overall profitability.
Lack of Consistent Tracking
Inconsistent data collection makes it difficult to identify trends and make informed decisions.
Overlooking Customer Behavior
Understanding how customers interact with machines is just as important as tracking sales.
The Future of Vending Analytics
Performance measurement will continue to evolve with technology.
Future trends include:
- AI-driven performance optimization
- Real-time analytics dashboards
- Predictive business insights
- Automated decision-making systems
These advancements will allow operators to manage vending networks with greater precision and efficiency.
Conclusion
In modern automated retail, success is defined by data. Self-service vending machines are no longer passive assets—they are measurable, optimizable business units.
By focusing on key performance metrics and ROI, operators can make smarter decisions, improve efficiency, and maximize profitability.
In 2026 and beyond, the most successful vending businesses will be those that treat data not just as information—but as a strategic advantage.